2026 StrategyDigital Divination
Life K-Line: Quantifying Destiny in the Fire Economy
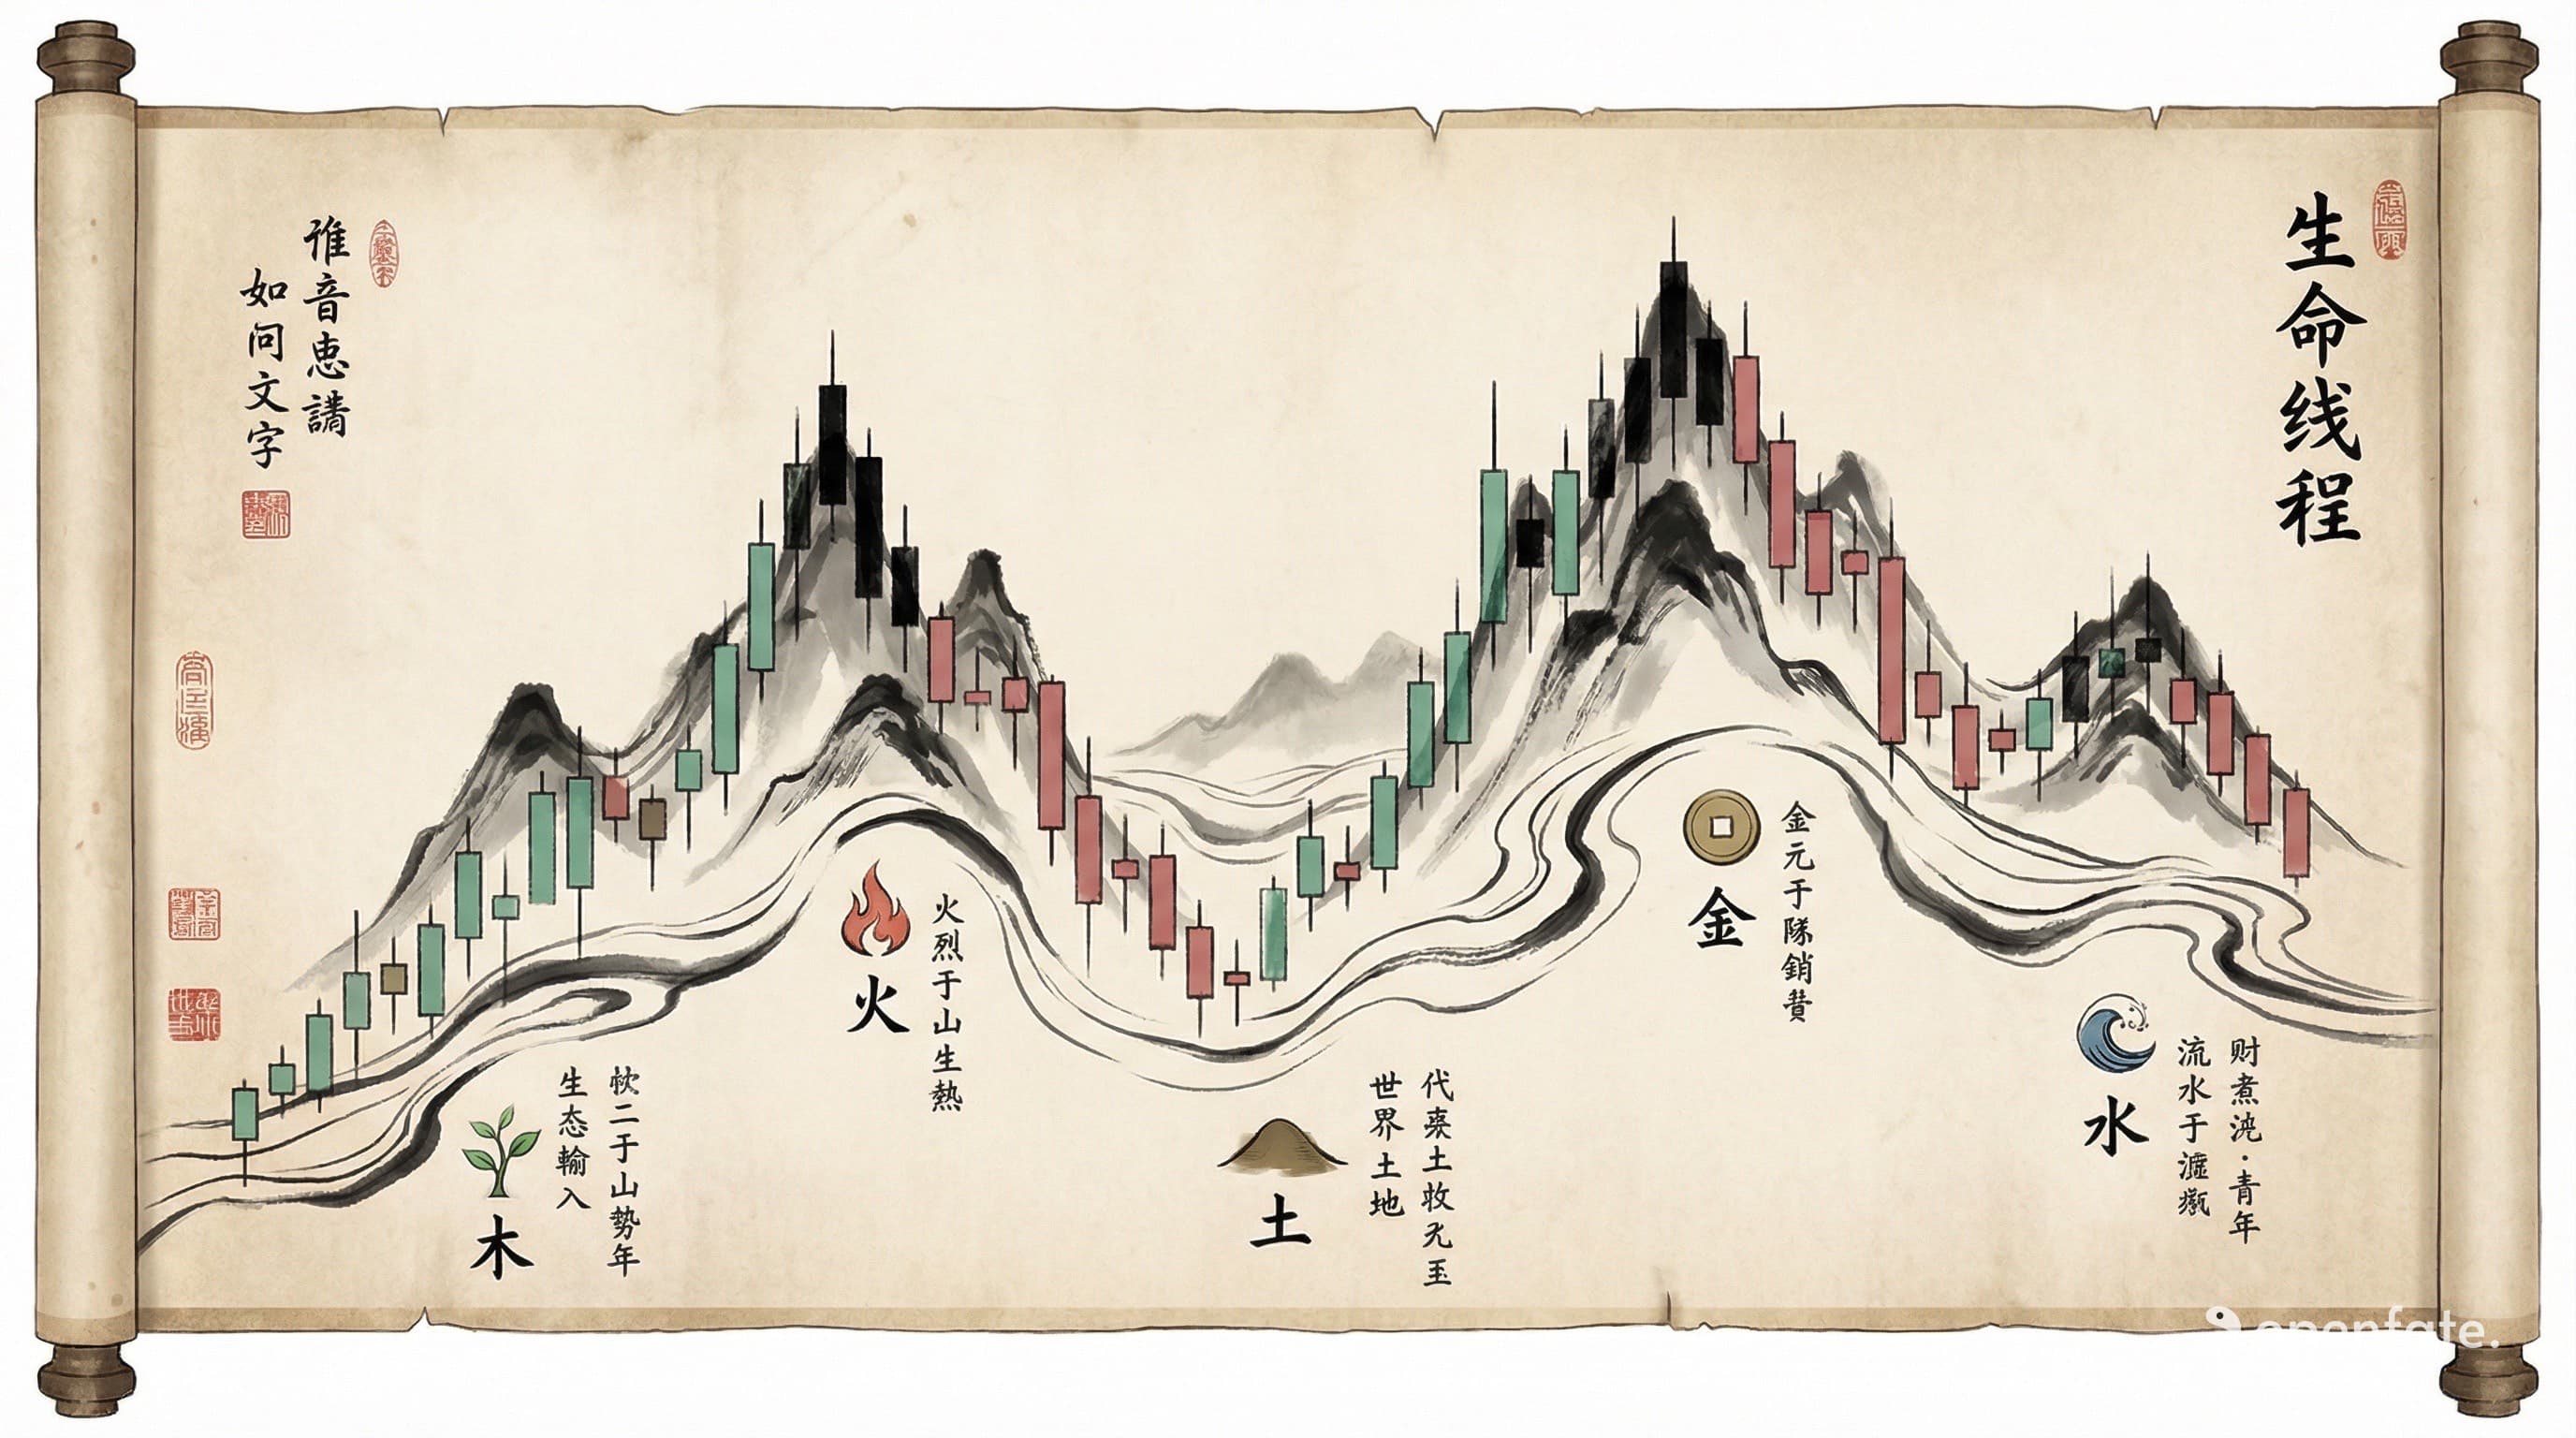
Core Answer
A Life K-Line visualizes symbolic timing cycles so users can compare consolidation, expansion, and volatility themes. It is a reflection tool, not high-resolution destiny data or a market-timing guarantee.
Introduction
1 AM. Server overload. Millions are waiting for AI to generate their "Life K-Line." But this is more than a viral meme; it is a subconscious reaction to the impending "Metaphysical Singularity" of 2026.
In the Bing Wu (Fire Horse) year, both the global economy and personal fortunes enter "High Volatility Mode." Traditional text horoscopes cannot capture this explosive fluctuation of energy.
You need a chart. You need to see where your "Energy Stock" bottoms out and where it hits the circuit breaker. This is thereview your timing approach — converting Bazi symbolism into a visual dashboard for navigating uncertainty.
The Algorithmic View: Why Bazi Can Be Shown as a Candlestick Chart
A Bazi K-Line is a visual analogy. Just as market charts show changing conditions, this chart shows how timing themes and relative element pressure change across periods.
Our AI engine does not just look at zodiacs; it calculates the strength of your "Day Master." In your Life K-Line, a red bullish candle might represent the 2026 "Yang Ren" (Goat Blade) moment — energy that is extremely high but carries the risk of physical or financial injury.
A green bearish dip might represent the "Missing Water Crisis" — a period where your resources (liquidity/wisdom) dry up completely. This is a symbolic risk signal, not a medical or financial prediction.
2026 Exclusive: Reading Your "Volatility Index"
Why is the "Life K-Line" viral this year? Because 2026 is framed as a high-Fire year associated with speed and volatility.
Users are no longer satisfied with vague "good luck." They want clearer review windows and risk questions.
For a Ren Water Day Master, the K-Line might show a massive "Rollercoaster" — the clash between Water and Fire bringing opportunity alongside elevated risk. For a Ji Earth Day Master, the chart might signal a "Parched Earth" pattern and prompt earlier attention to workload and recovery.
Core Features: From Prediction to Decision
Quantifying "The Edge" (Yang Ren):
Identify the months of highest symbolic intensity in 2026. Use them as review points, not direct leverage or market instructions.Missing Element Alert:
The K-Line visualizes exactly when your "Water" element hits zero — the bottom of your personal Bear Market.AI Hedging Strategies:
We don't just draw the chart. The Gemini/GPT-4 model provides specific "hedging" advice for your dips.
Conclusion
In the algorithmic age, symbolic timing can be visualized without pretending life is a tradable asset.
2026 is full of uncertainty. Generate your K-Line, review the trend, and compare it with real-world evidence before making decisions.
FAQ
What is a "Life K-Line"?
It is a visualization tool that maps Bazi energy fluctuations. By calculating the Day Master strength relative to the yearly cycles, it creates a chart similar to stock market candlesticks.
Is this based on data or just symbolism?
The underlying logic comes from traditional Bazi elemental interaction. It is not a stock predictor and should be treated as a symbolic view of timing themes.
What should I do when my K-line hits a "support level" or dip?
A dip represents energy suppression. This is a time for defensive strategies—avoiding high-risk commitments and focusing on internal growth and refinement.

Disclaimer: Metaphysics is a traditional cultural perspective, not a substitute for modern science. Content is for reference only; please exercise rational judgment based on your specific situation.